Find and Kill the Agent That's Eating All Your RAM
Somewhere around the third time a quiet overnight session ballooned to eight gigabytes, I stopped blaming the agents. It’s rarely the agent itself. It’s the long tail underneath: an MCP server that leaks, a headless Chrome nobody closed, a jest run that left thirteen half-gigabyte workers behind, an orphaned subprocess whose parent died days ago.
Activity Monitor is useless here. It shows a wall of anonymous node processes and can’t answer the three questions that matter: which session is this, what inside it is actually fat, and how do I get the session back after I kill it.
So I built agent-ram-monitor. It answers all three, as a CLI and a macOS menu bar app.macOS, Python stdlib only, no pip installs. The menu bar app is a single Swift file compiled at install time. I launched it on X with the demo above.
If you run agents all day, steal it. In this economy, RAM is one of the more expensive resources you can own, and the math is simple: every gigabyte a leak eats is a gigabyte that could be running another agent.
Sessions, not processes
The unit that matters is the session, not the process. Every running Claude Code, Codex, or Copilot session shows up as one row, with RAM aggregated over its whole process tree: subagents, MCP servers, spawned shells and browsers all count toward the session that owns them. Children are classified, so “is it a bad MCP?” is answered at a glance.
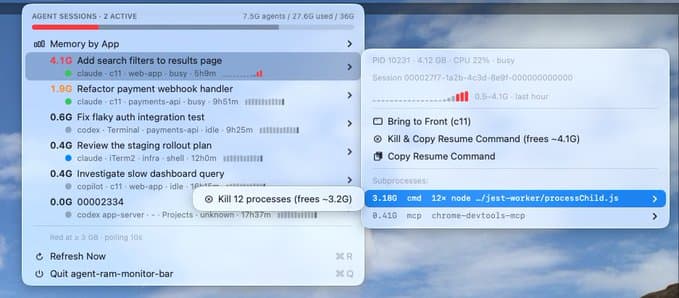
The submenu is the point. Killing a fat session used to mean losing the session. Here every session is mapped back to its resumable ID, so the fix is one click: kill, paste the resume command, and the agent picks up where it left off with a fresh memory footprint. The worker pool collapses the same way: one action reaps twelve jest workers and tells you up front that it frees 3.2 gigabytes.The PID-to-session mapping is the fiddly part: session files, argv flags, and creation-time pairing per project directory, so ten sessions in the same repo each resolve to their own ID. For sessions hosted in c11 the live tab title comes from the multiplexer’s state files.
The flight recorder
Blowups happen while you’re not looking. The menu bar app logs every ten-second scan to a ring buffer, and turns red the moment any session crosses 3 GB. After an incident, blame reconstructs what happened:
That’s a real shape of incident: nine gigabytes in about a minute, attributed to the npm test subtree of one named session. No guessing, no scrolling through Activity Monitor at midnight.
It’s open source and deliberately boring to install. If it saves you one lost overnight session, it has paid for itself.
If you found this helpful, share it: